
Indians now spend 67% of household budgets on non-food items and services: SBI Research
ADVERTISEMENT
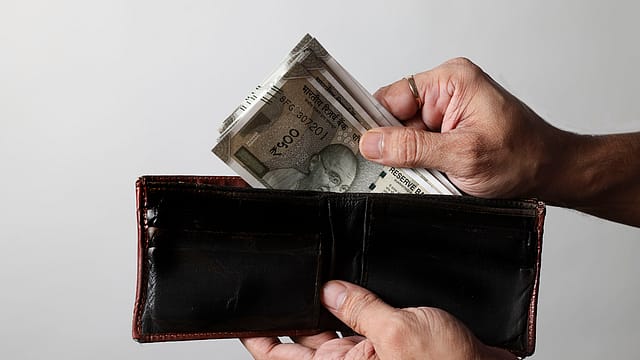
Indian households are gradually shifting their spending towards non-food items and services, which together account for nearly 67% of total household expenditure, while food essentials make up the remaining 33%, according to SBI Research.
An analysis of the Household Consumption Expenditure Survey (HCES) 2023-24 highlights changing dietary preferences, rising adoption of digital shopping platforms, and persistent rural-urban disparities in access to clean cooking fuel and food-security benefits. The findings also point to variations in food consumption across states, genders and household compositions.
Protein-rich diets gain ground
Consumption patterns for protein-rich foods vary considerably across states, reflecting differences in dietary preferences. The report also identifies gender-based disparities in dietary diversity, with men recording higher consumption across most states. The gaps are particularly pronounced in Telangana, Odisha, Punjab, and Chhattisgarh.
Household spending also varies across food categories, even among families with similar expenditure levels. The widest differences are observed in cereals and pulses, followed by milk and milk products. In contrast, expenditure patterns on eggs, fish and meat, vegetables, dry fruits and fresh fruits show relatively lower variations across households.
SBI Research said the findings indicate growing awareness of dietary choices, with households across income groups allocating expenditure towards protein-rich foods, vegetables, and fruits.
Family composition also influences food budgets. Households with more elderly members tend to spend relatively more on milk, fruits and vegetables, while families with young children allocate expenditure towards milk and milk products, as well as served and packaged food.
Digital shopping grows, but food purchases remain limited
Digital platforms are gradually changing household purchasing behaviour, although adoption varies significantly across categories.
According to the report, digital purchases are concentrated in consumables and services, accounting for 39.68%, followed by durable goods at 23.3%. Food items account for just 7.1% of digital purchases.
Online adoption remains particularly limited for vegetables (1.32%), fresh fruits (1%), dry fruits (0.62%) and eggs, fish and meat (0.59%). This reflects consumers' continued reliance on traditional retail channels for perishable food items.
Digital adoption is relatively higher for clothing (19.97%) and footwear (12.05%). However, online purchases remain limited for furniture (0.18%), medical equipment (0.32%), and recreational goods (0.52%), indicating a continued preference for offline channels in these categories.
Rural-urban divide persists in LPG access
Access to liquefied petroleum gas (LPG) varies considerably across states. Goa and Punjab report high adoption, followed by Andhra Pradesh, Karnataka and Tamil Nadu. Usage remains relatively low in Odisha, Chhattisgarh, Jharkhand, Rajasthan and Bihar.
The rural-urban divide is particularly stark in Jharkhand, where LPG usage stands at 17.2% among rural households, compared with 77.6% in urban areas. In Chhattisgarh, the corresponding figures are 15.3% and 81.3% while Odisha records 16.8% rural usage against 63.5% in urban areas.
Rajasthan also reports a substantial gap, with rural LPG usage at 22.9%, compared with 85.6% in urban areas. Assam and West Bengal show similar disparities, with rural usage at 36.3% and 20.5%, respectively, against 94.3% and 82.9% in urban areas.
Rural households dominate food-security coverage
Coverage under the Pradhan Mantri Garib Kalyan Anna Yojana (PMGKAY) also shows significant rural-urban variation, with rural households accounting for a larger share of reported beneficiaries in most states.
The gap is particularly pronounced in Gujarat, where rural coverage stands at 61.3%, compared with 19.7% in urban areas. Maharashtra records rural coverage of 63.3% against 18.9%, while Rajasthan and Karnataka report corresponding rural-urban figures of 66.5% versus 26.4%, and 71.1% versus 34%.
Rural coverage is particularly high in Andhra Pradesh (90.5%), Telangana (89.3%) and Chhattisgarh (87.1%) while it is comparatively low in Himachal Pradesh and Punjab.
Survey captures changing consumption patterns
The analysis draws on HCES 2023-24, conducted by the National Statistics Office under the Ministry of Statistics and Programme Implementation between August 2023 and July 2024.
The SBI Research dataset covers 261,953 households, including 154,357 rural and 107,596 urban households across states and Union Territories. Monthly per capita consumption expenditure serves as the principal indicator for analysing household spending patterns, alongside demographic, employment, housing, and digital purchasing data.