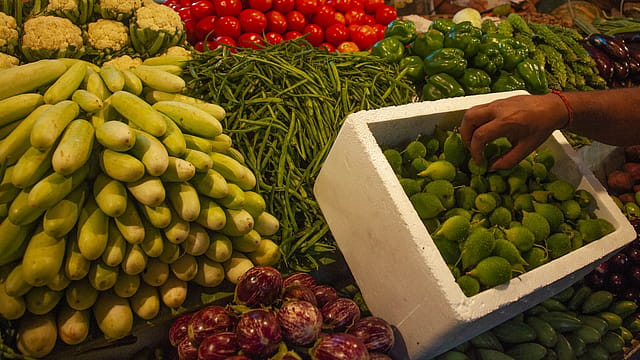
Indians paid 50-100% more for vegetables in two years
ADVERTISEMENT

The monthly household expenditure on vegetables has almost doubled over the last two years, says a significant number of respondents in a nationwide online survey. The findings of the survey, conducted by the community social media platform LocalCircles, reveal that 76% of the respondents saw their monthly vegetable budget increase between 25-100% in the last two years.
The pan-India survey received over 22,000 responses from household consumers located in 307 districts of India.
To the question “How much has your monthly household expenditure on vegetables changed from 2020 to 2022?” 36% of households said they are now spending 25-50% more to buy vegetables. Another 31% of the respondents put the increased expenditure to 50-100% and 9% to over 100% increase.
The survey also tried to capture the price rise in vegetables like tomatoes, onions and potatoes during the current year. The responses suggest that 1 in 2 households surveyed paid, on average, more than ₹50/kg for tomatoes, ₹30/kg for onions and ₹25/kg for potatoes in 2022. To the question “What best describes the per kilogram price that your household paid on average for tomato, onion and potato this year”, 27% of the respondents said they bought tomatoes for ₹60 or higher, onions for ₹35 or higher and potatoes for ₹30 or higher. Another 23% revealed that they have paid ₹50-60 for tomatoes, ₹30-35 for onions, and ₹25-30 for potatoes. There were 7% who said the price range for tomatoes was ₹40-50, for onions ₹25-30 and between ₹20-25 for potatoes.
January 2026
Netflix, which has been in India for a decade, has successfully struck a balance between high-class premium content and pricing that attracts a range of customers. Find out how the U.S. streaming giant evolved in India, plus an exclusive interview with CEO Ted Sarandos. Also read about the Best Investments for 2026, and how rising growth and easing inflation will come in handy for finance minister Nirmala Sitharaman as she prepares Budget 2026.
The findings of the survey indicate that the vegetable price rise at the consumer level could be higher than what is captured by the inflation data released by the National Statistical Office (NSO).
According to NSO data, India's retail inflation continued its rise in September to a five-month high of 7.41% year-on-year, driven by surging food prices. The food and beverage price index has over 45% weightage in NSO’s monthly consumer price index. The food price inflation was 8.60% in September as against 7.62% in the previous month. Of the survey respondents, 42% were from tier 1 cities, 33% from tier 2 and 25% from tier 3, 4 and rural districts.
