Sensex@40: 13% return generated every year from 1986 to 2025
/ 4 min read
The benchmark index returns of Asia's oldest stock exchange are in line with the nominal GDP growth of 12.62% clocked over the same period
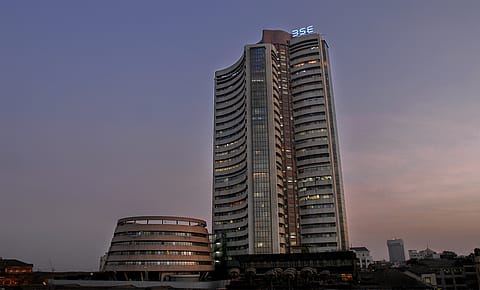
The Sensex was created in the year 1986 | Credits: Fortune India
V Keshavdev & Sandeep Karkera
On January 1, 2026, the Sensex completes 40 years as the benchmark index of Asia’s oldest stock bourse, the Bombay Stock Exchange (BSE). The four-decadal growth in the Sensex is a story capturing India’s own rise to becoming the world’s fourth-largest economy, generating a CAGR of 13.4% from an index level of 549 points to 85,220 on the last trading day (Dec 31) of the current calendar year.
The CAGR return is in sync with the country’s own nominal GDP growth of 12.62% clocked over the same period from Rs 2.85 lakh crore in FY86 to Rs 330.68 lakh crore in FY25, mapping the cycle of change across the economic and corporate landscape. In other words, there has been no significant alpha generated over the nominal GDP growth delivered over the four decades.
While the Bombay Stock Exchange has been in existence since 1875, it was in 1986 January, that the 30-share index was formally constituted.
The early 1990s marked the first dramatic acceleration in returns. Liberalisation triggered a re-rating of Indian equities, and returns exploded. In 1991 alone, the Sensex rose over 90%, followed by another 33% gain in 1992. In just two years, investor wealth more than doubled. This period remains one of the fastest return expansions in the index’s history, driven by policy measures rather than earnings compounding.
From 1996 to 1998, Sensex returns told a sobering story. Two of the three years delivered negative performance, and the one positive year offered only low double-digit gains. The index oscillated between 3,000 and 3,700, generating poor compounded returns despite large intra-year swings.
Returns surged spectacularly in 1999, with the Sensex gaining over 63% in a single year. This rally marked the first time technology-led optimism translated into outsized equity returns. Investors who entered at the start of 1999 saw rapid wealth multiplication.
That wealth, however, proved fragile. Between 2000 and 2002, the index delivered three consecutive weak years, including two deep negative-return years. A large portion of the 1999 gains was given back.
The most powerful returns chapter in Sensex’s history began in 2003. That year alone delivered over 72% returns, followed by four consecutive years of double-digit and high double-digit gains. Between the start of 2003 and the end of 2007, the index rose from roughly 3,400 to over 20,000. In return terms, this was a near six-fold increase in five years, translating into extraordinary compounded annual growth.
The global financial crisis of 2008 produced the single worst annual return in the index’s history. The index collapsed by more than 52%, destroying half of investor wealth. Long-term compounding temporarily broke down as fear replaced optimism.
The 2010s marked a clear shift in the returns profile. Annual gains became more moderate, interspersed with sharp negative years such as 2011 and mild declines in 2015. Strong years like 2014 and 2017 delivered over 30% and 28% returns respectively, but these were exceptions rather than the norm.
{{#most-powerful-women-snapshot-individual.slug}} {{/most-powerful-women-snapshot-individual.slug}} {{^most-powerful-women-snapshot-individual.slug}} {{/most-powerful-women-snapshot-individual.slug}} {{#showRanking}} {{current-rank}} {{/showRanking}} {{#photo.0.url}}
{{name}}
The pandemic years reshaped the return narrative yet again. Despite the sharp intra-year collapse in early 2020, the Sensex ended the year with positive returns of over 15%. In 2021, returns accelerated further, with the index gaining nearly 22%
From 2022 onward, returns entered a more mature phase. Annual gains moderated to low double digits and high single digits. While absolute index levels surged past 85,000 by the end of 2025, percentage returns reflected the challenge of compounding from a much larger base.
That only seven companies have remained part of the Sensex across its 40-year history is less a story of endurance and more a story of reinvention. None of these companies--Hindustan Unilever, ITC, Larsen & Toubro, Mahindra & Mahindra, Reliance Industries, Tata Motors Passenger Vehicles, and Tata Steel--look today the way they did in the mid-1980s. Their survival has depended on recalibrating loss-making legacy businesses, embracing new ventures, and repeatedly adapting themselves to the evolving business and economic realities.
Reliance Industries shifted from textiles and petrochemicals to telecom, retail, and financial services, unlocking value through demergers and new listings. Tata Motors Passenger Vehicles bears little resemblance to the original commercial vehicle–centric company, with its current identity anchored in passenger vehicles and Jaguar Land Rover, while the CV business is listed separately. ITC used cash flows from its tobacco business to build a large non-tobacco portfolio, Hindustan Unilever compounded steadily by deepening everyday consumption, and Larsen & Toubro evolved alongside India’s investment cycles through restructuring and portfolio churn. Mahindra & Mahindra adapted to changing mobility and rural demand, while Tata Steel survived commodity cycles through scale (Corus), exits, and fiscal consolidation.
In terms of sectors, from nil back in 1986, financials today make up 39% of the index, 12% is IT services, healthcare 2%, Services 2% and the remainder 45% constitute manufacturing companies, which at one point made up for 100% of the index. The current market capitalisation of the index is Rs 169.37 lakh crore, which is 36% of the entire market cap of BSE-listed companies.
At present, the index is trading a PE multiple of 23 times trailing 12-month earnings, fetching a return of 8.5% this year, which is second consecutive year of single-digit returns, far from what the CAGR shows.
It remains to be seen if history repeats, or if records are broken in the new year.
NEXT STORY